Where Should I Live
Rank cities around the world by what you’d keep after tax, what a month costs, which visas you can get and how each place fits the way you live.
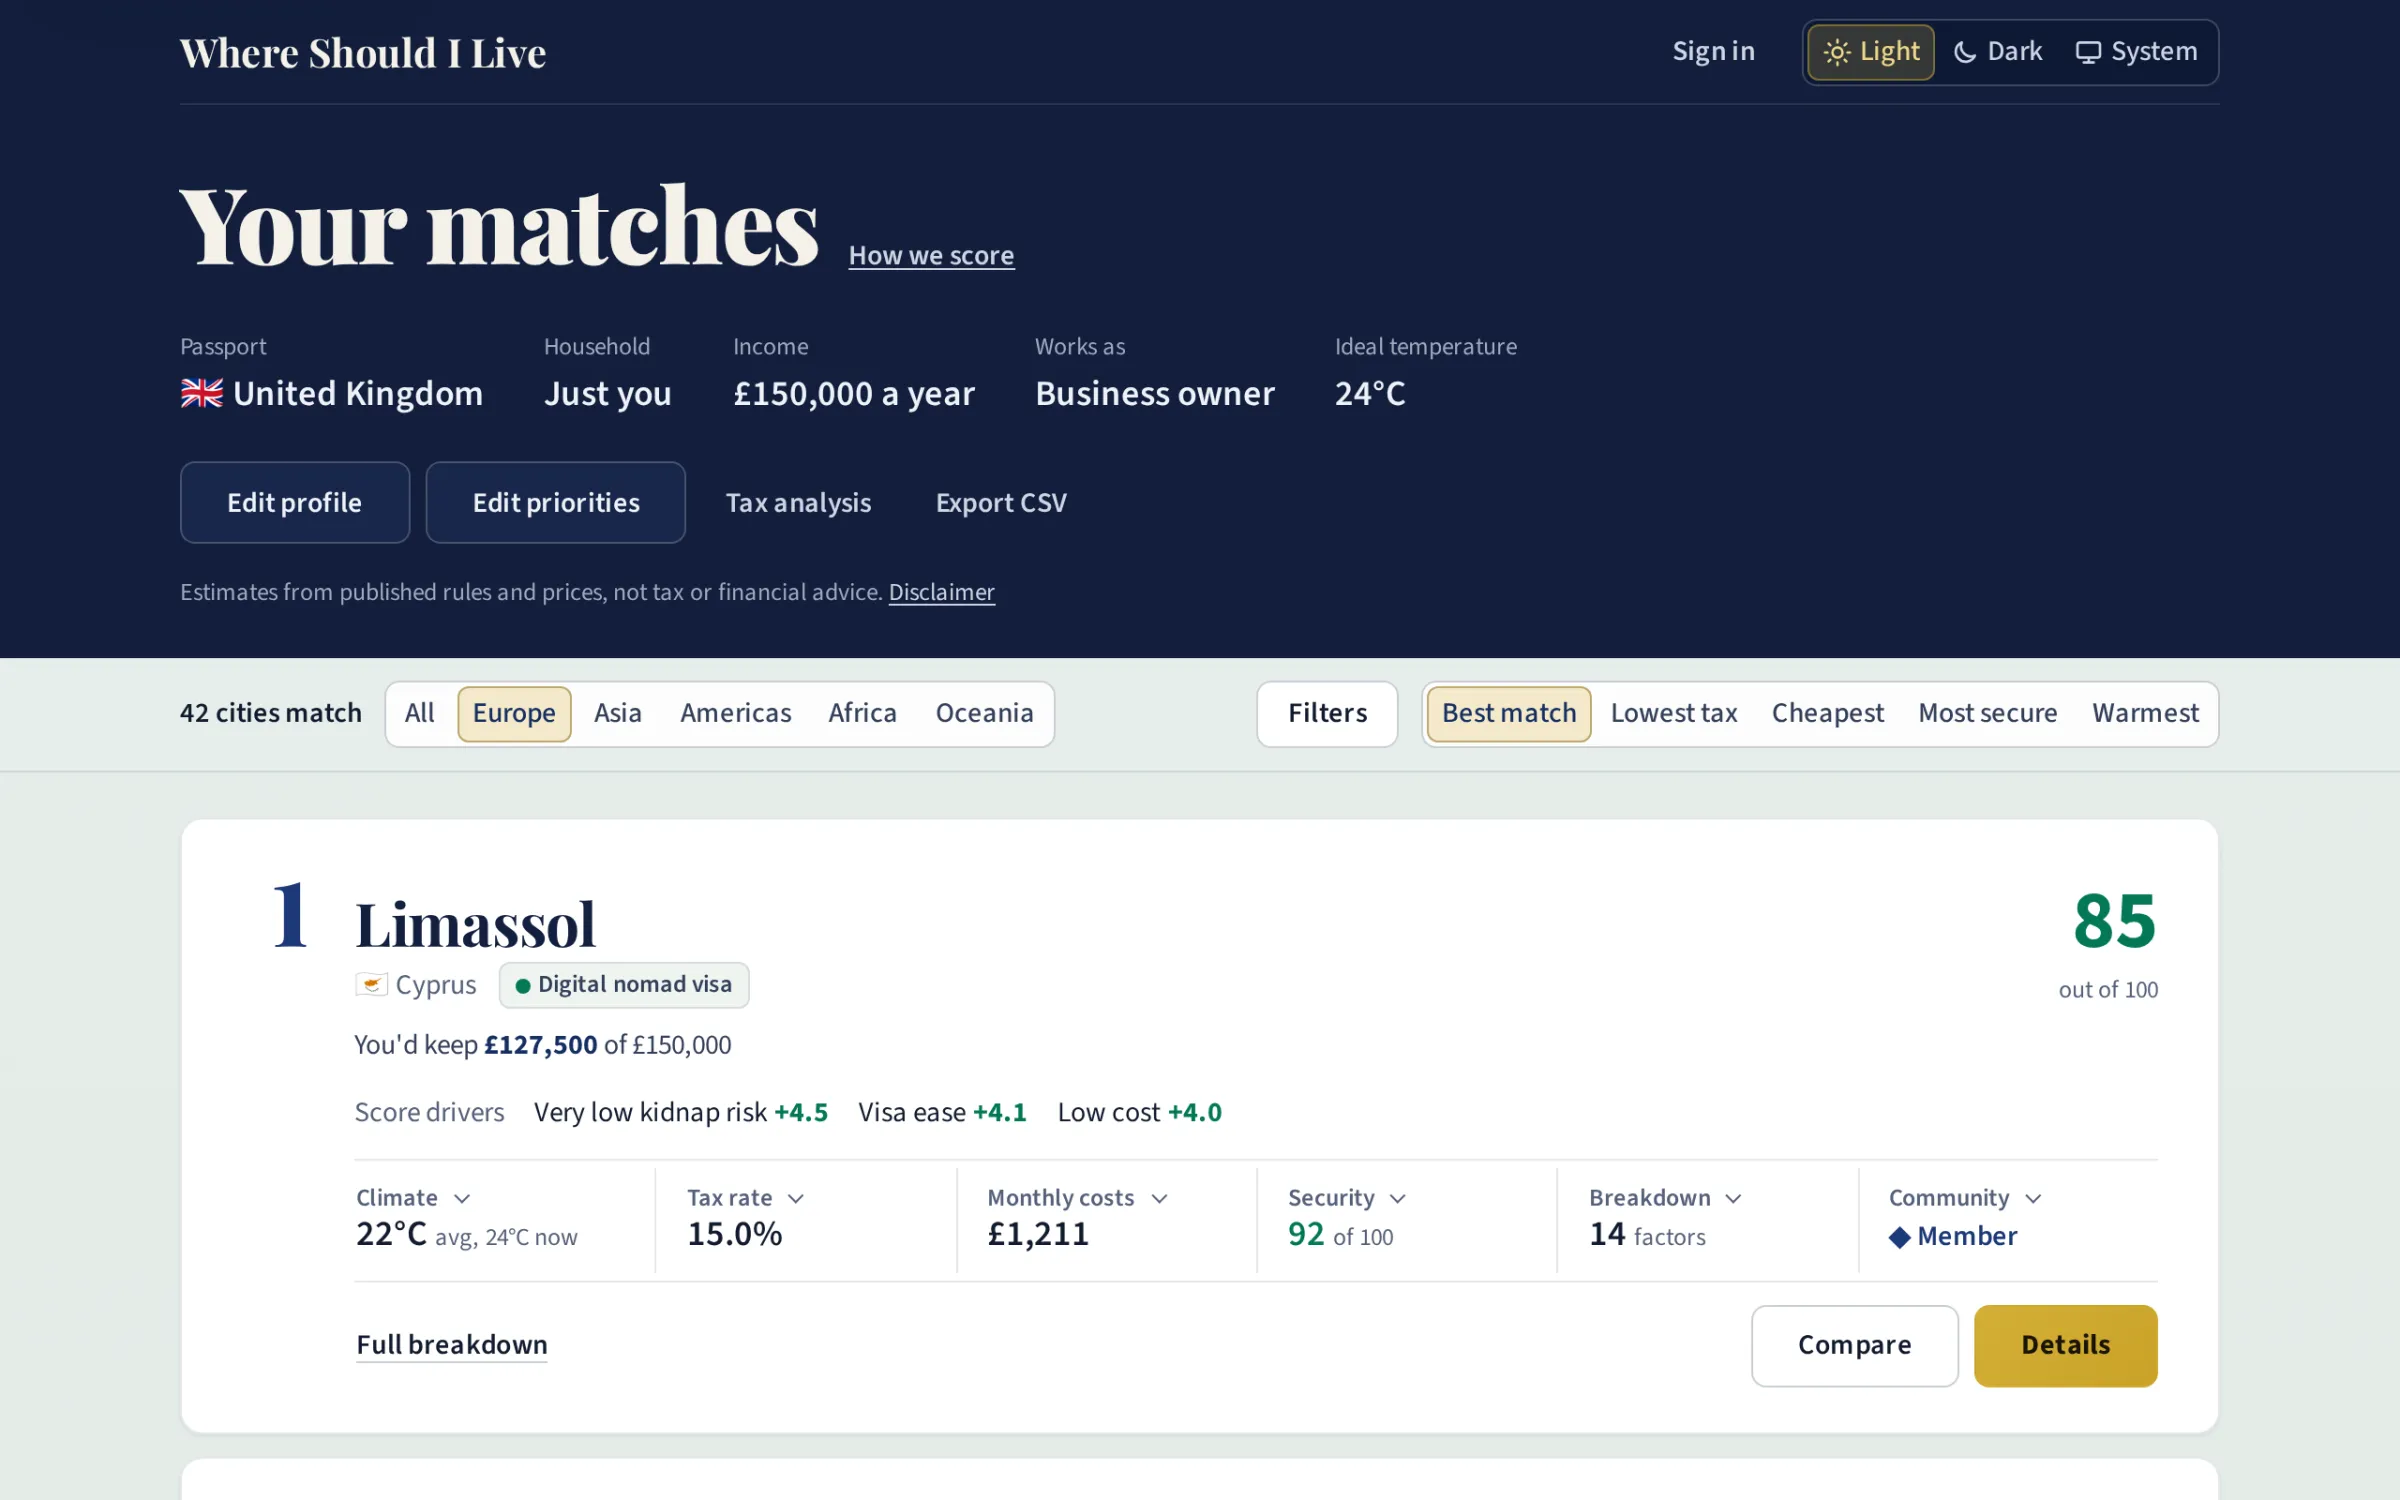

Where Should I Live ranks 78 cities by what you’d keep after tax, what a month would cost, how easily you could get a visa, the climate and the things you care about. It’s for anyone weighing up a move abroad: someone on a salary, a freelancer, a company owner or an investor, alone or with a family.
What it does
You answer six short steps of questions: what you earn and how, which passports you hold, who’s moving with you, and what matters to you. Each city then gets a match score out of 100. It starts at 50, and each factor adds or takes off points, weighted by your answers. By default tax, monthly cost, visa ease, safety, healthcare, climate and cultural safety count most, and time zone, corruption, alcohol and cannabis count less. You can change every weight afterwards.
For each city you see:
- your take-home pay after income tax and social contributions, worked out from that country’s real rules, with regional taxes where they apply (New York, Los Angeles, Geneva, five Spanish regions, Madeira and others)
- the monthly cost, line by line: rent, utilities, internet, a transport pass, eating out and groceries, plus childcare and school fees for a family
- the visa routes open to you on your passports, for short stays and for living there
- the climate, safety and time zone, and how the city compares with the one you live in now
For a household, each earner is taxed on their own income and the results are added up. Then the country’s joint filing, family deductions and credits and child benefits are applied, for the 29 countries that have them. Each cost line is scaled for the size of the household, and rent uses the city’s figure for the size of home you’d need.
You can compare up to three cities side by side, see the tax analysis across the list, and export it as a CSV. Signing in, by a link sent to your email, saves your answers across devices. Membership is free while the app is in early access.
Where the data comes from
Tax rules for 57 countries were researched in October 2026, mainly from official government publications, and spot-checked against official tax calculators. Rent, food, utilities, transport and childcare come from official and open sources such as the Office for National Statistics, Eurostat, the US Department of Housing and Urban Development and national statistics offices. Every cost line records how it was arrived at, and estimates are marked as estimates in the app. The sources page lists every source and its licence.
How it’s built
The first version kept its data in JavaScript files, and adding a city meant editing six or seven of them by hand. This version moves the data into a headless backend, which is the single source of truth for every city, tax regime and visa rule.
The app’s tax, scoring and visa calculators came from the first version, and they expect its JSON shapes. So the backend re-serialises its content into exactly those shapes, and a written data contract records every field, every quirk to preserve and every string the code depends on. The same serialiser feeds a JSON API for development and a static snapshot for production. The live app reads the snapshot, so the rankings need no server at all. The backend is only called for accounts and live weather.
Changes to the data go through backend commands: add a city, refresh a country’s tax, refresh costs, exchange rates or visa rules. Each command checks its payload against the data contract first and writes nothing if anything is wrong. Then it updates the records by their natural keys. Each command also has a matching Claude Code skill, which researches current figures and builds the payload.
A release won’t build unless the data passes its checks. One command rebuilds the snapshot from the backend and compares it field by field with the reviewed baseline, so any change shows up as a diff. Then the real calculators run over every country and city, against golden tax figures, and tests confirm that a single person’s figures are identical with and without the household model. Only then does Vite build the client.
The client is plain JavaScript with Vite, with no framework. Chart.js loads only when the first chart is drawn. A Playwright suite covers every view, with one review spec running in Chromium, Firefox and WebKit, and an axe audit fails the suite on any accessibility violation, in both themes, at desktop and phone widths.
The static build is hosted on 123 Reg behind Cloudflare. Production’s database is the source of truth for content: each data change is made and reviewed locally first, then the same command is run on production.
How to use it
Open tax.dealmobile.co.uk and answer the questions. The results use your answers straight away, and Edit priorities changes what counts. The figures are estimates, not financial or immigration advice.
The first version
The first version, from November 2025, is still online and kept as it was. It ranked 65 cities from data hard-coded into the app, and its calculators were the starting point for this version’s. Its tax and price figures date from early 2026, so use the current app for anything up to date.